Service graphs
Graph Information
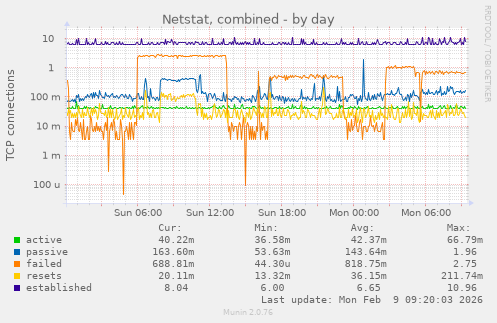
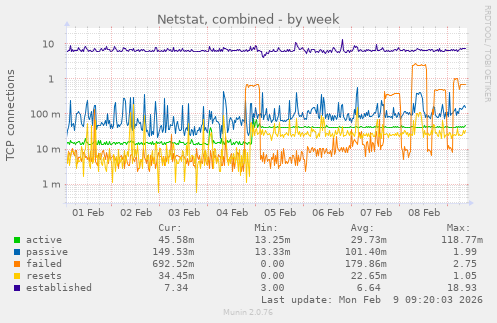
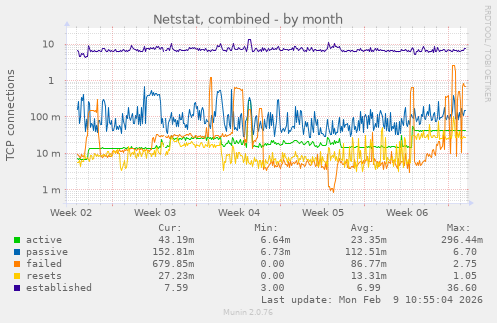
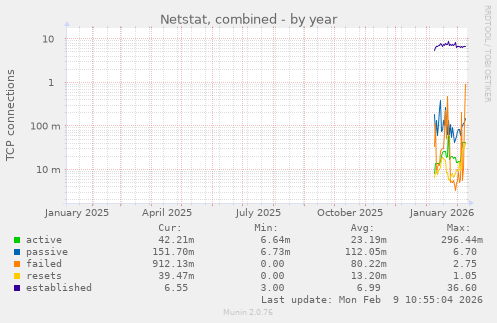
This graph shows the TCP activity of all the network interfaces combined.
| Field |
Internal name |
Type |
Warn |
Crit |
Info |
| active |
active |
derive |
500 |
2000 |
The number of active TCP openings per second. |
| passive |
passive |
derive |
500 |
2000 |
The number of passive TCP openings per second. |
| failed |
failed |
derive |
500 |
2000 |
The number of failed TCP connection attempts per second. |
| resets |
resets |
derive |
500 |
2000 |
The number of TCP connection resets. |
| established |
established |
gauge |
500 |
2000 |
The number of currently open connections. |